Data from wind farm study
windFarms.RdData from a study of the effect of offshore wind farms on fish communities (Bergström et al. 2013), with measurements before (2003) and after (2010) wind farm installation at 36 different sites in three zones -- two affected by wind farms, and two control zones. Abundances have been recorded for 16 different taxa.
Usage
data(windFarms)Format
A list containing three objects:
- X
A data frame with descriptors of location and time of sampling. These include: `Year`, a factor giving year of sampling, only 2003 and 2010 measurements are available here; `Zone`, a factor giving zone of sampling,
WFfor wind farm,Nfor Northern zone,Sfor Southern zone; `Station`, a factor indicating station ID; `Impact`, a factor indicating whether sampling is `Before` or `After` wind farm construction.- abund
A data frame containing abundances of 16 different fish taxa.
- totalAbund
The total abundance of fish at each site.
References
Bergström, L., Sundqvist, F., & Bergström, U. (2013). Effects of an offshore wind farm on temporal and spatial patterns in the demersal fish community. Marine Ecology Progress Series 485, 199-210.
Examples
data(windFarms)
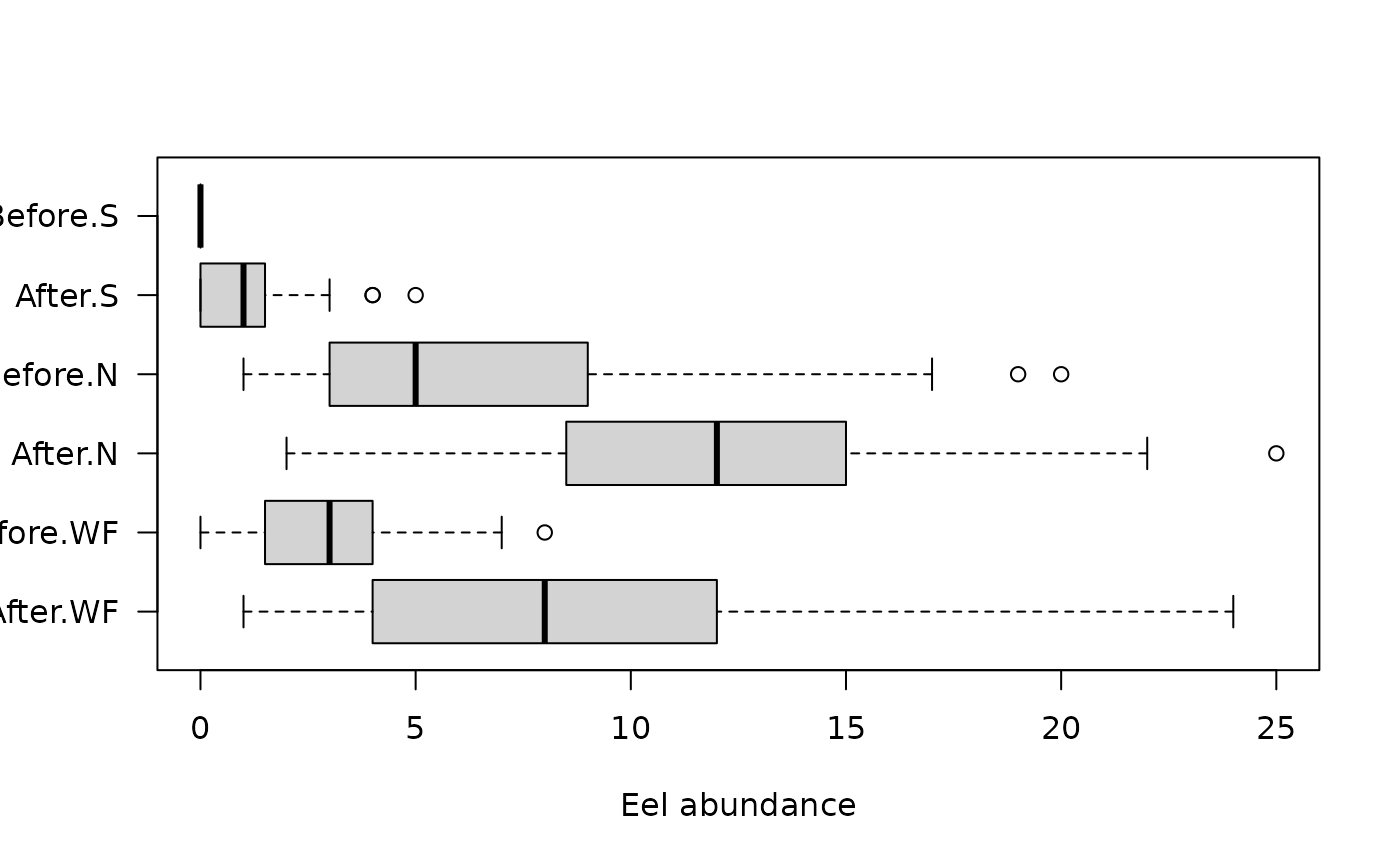
eels =windFarms$abund[,14]
plot(eels~interaction(Impact,Zone), data=windFarms$X, horizontal=TRUE,
  las=1, xlab="",ylab="Eel abundance")
