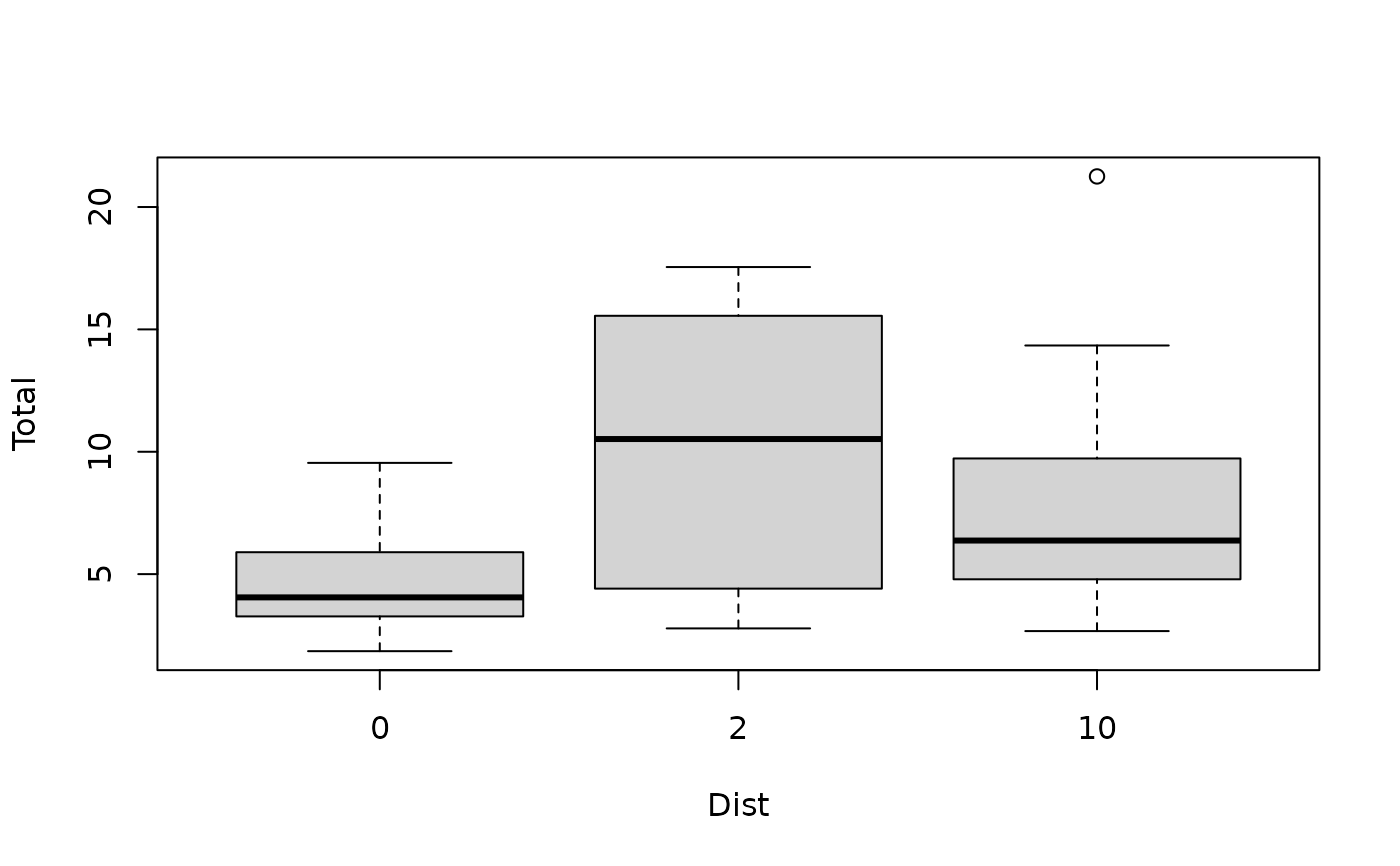
Habitat Configuration data from seaweed experiment
seaweed.RdData from a study of habitat configuration, specifically, does density of invertebrate epifauna on seaweed vary across sites with different levels of isolation from each other.
Usage
data(seaweed)Format
A dataframe containing:
- Size
A character vector describing size of experimental plots as "SMALL" or "LARGE"
- Dist
Distance of isolation -- 0, 2 or 10 metres from other algal beds
- Time
Sampling time - either 5 or 10 weeks from the start of the experiment.
- Rep
The replicate number (1 to 5).
- Wmass
Wet mass of the algal bed for that plot.
- Total
Total invertebrate density in the plot, calculated as nuber of individuals divided by
Wmass.
Other variables in the dataset give invertebrate counts separately for different taxa.
