Invertebrate abundances in a revegetation study
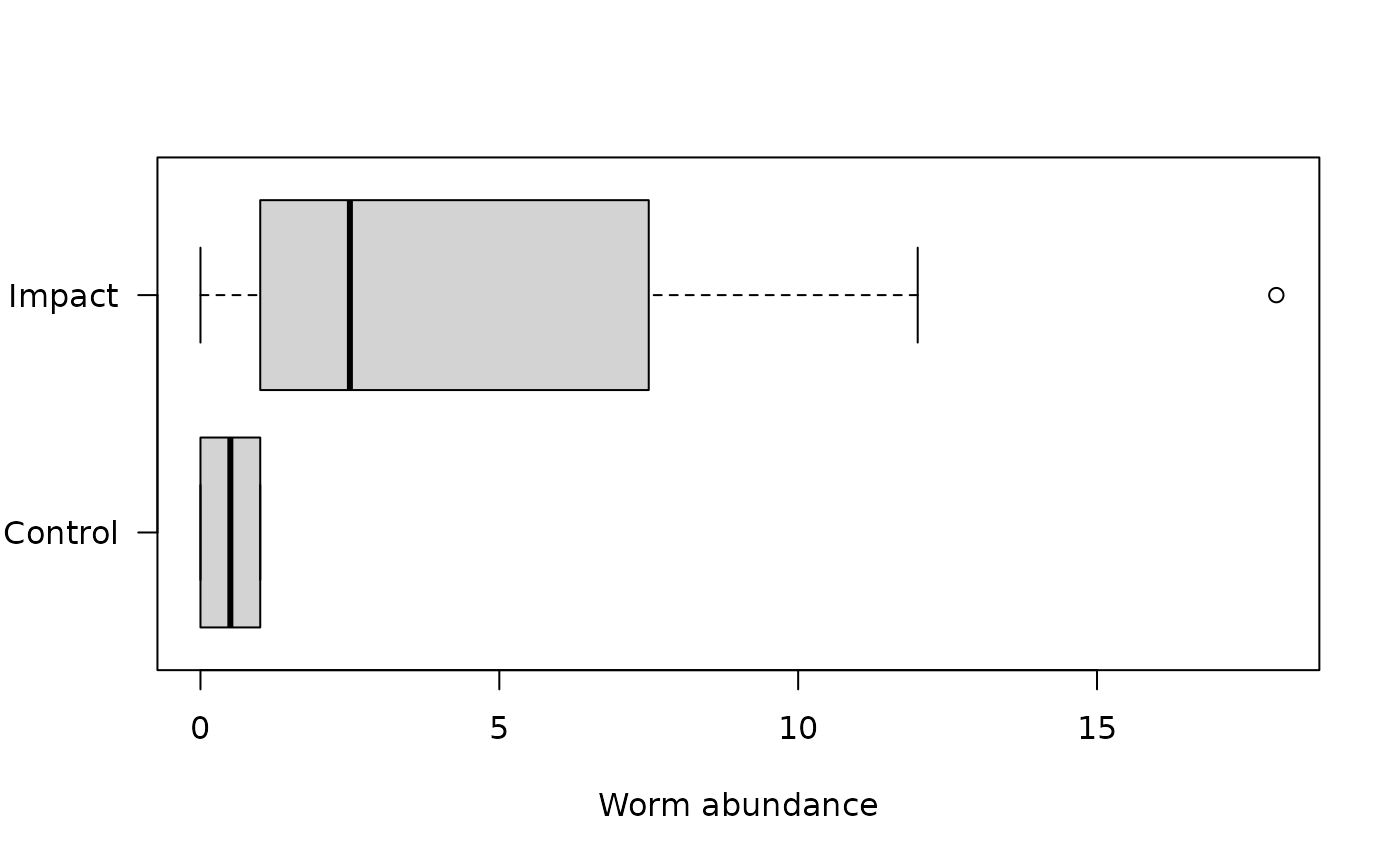
reveg.RdData from a study looking at the effect of revegetation on invertebrate communities (data from Anthony Pik, Macquarie University). Invertebrates were sampled in 4-5 pitfall traps at eight sites that had undergone revegetation, and two sites that hadn't, and it was of interest to see what the effect of revegetation was on the invertebrate community.
Usage
data(reveg)