Ravens data
ravens.RdData from a study of whether ravens fly towards the sound of gunshots (White 2005). Many thanks to Crow White for providing the raw data. There were twelve locations, at which four treatments were applied (1=gunshot, 2-air horn, 3=whistle, 4=no sound). Ravens within a 100 metre radius of the author were counted ten minutes before and ten minutes after each treatment was applied. Primary interest was in assessing if there was an effect of gunshot on raven numbers. Posthoc analyses suggested that ravens were attracted to gunshots in forested areas only.
Usage
data(ravens)Format
A dataframe containing:
- Before
The number of ravens before the treatment was applied
- After
The number of ravens after the treatment was applied
- delta
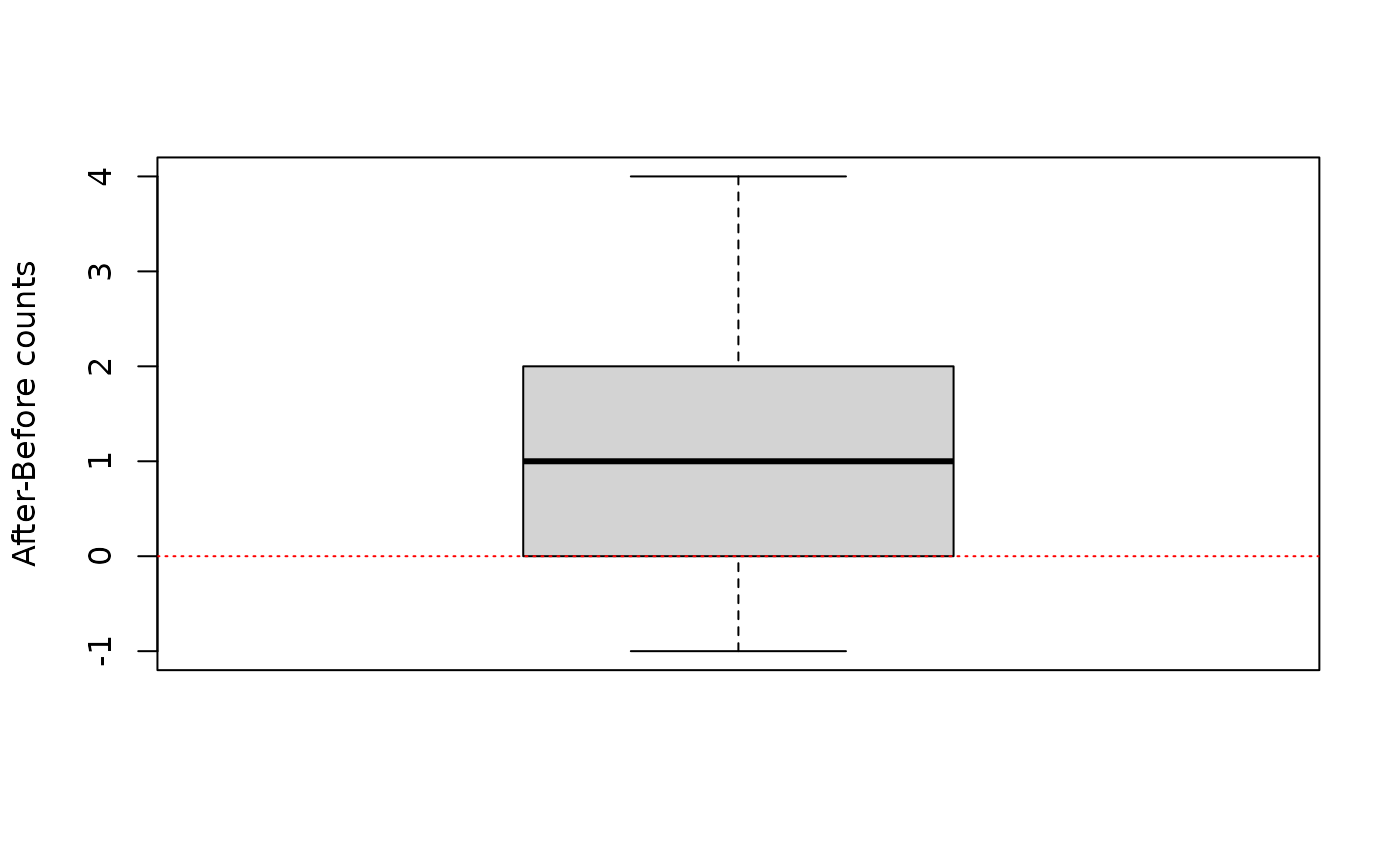
After-Beforecount- site
Location, one of twelve in Jackson Hole, Wyoming's ungulate hunting zone
- treatment
1=gunshot, 2=air horn, 3=whistle, 4=no sound
- trees
1=forested habitat (>300 trees within 100 metres of observer), 0=open
References
Crow White (2005) Hunters ring dinner bell for ravens: experimental evidence of a unique foraging strategy. Ecology, 86 1057-60.
Examples
data(ravens)
ravens1 = ravens[ravens$treatment==1,]
t.test(ravens1$Before,ravens1$After,paired=TRUE,alternative="less")
#>
#> 	Paired t-test
#>
#> data:  ravens1$Before and ravens1$After
#> t = -2.6, df = 11, p-value = 0.01235
#> alternative hypothesis: true mean difference is less than 0
#> 95 percent confidence interval:
#>       -Inf -0.335048
#> sample estimates:
#> mean difference
#>       -1.083333
#>
boxplot(ravens1$delta,ylab="After-Before counts")
abline(h=0,col="red",lty=3)
