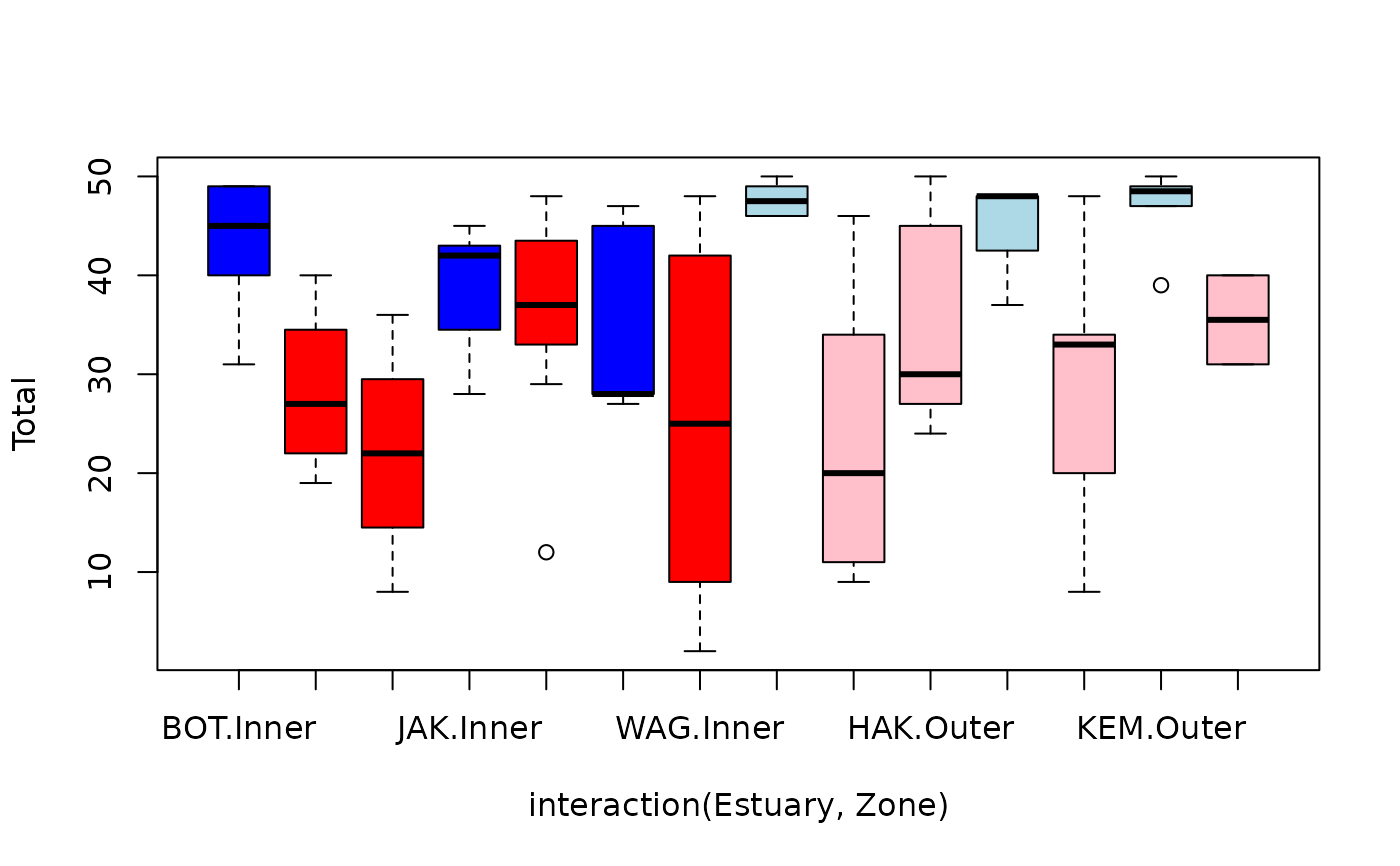
Effect of pollution on marine microinvertebrates in estuaries in different zones
estuaryZone.RdData from an observational study of whether there is a different in microinvertebrate communities between estuaries that have been heavily modified by human activity and those that have not, across seven estuaries along the coast of New South Wales, Australia (Clark et al. 2015). Sampling was undertaken in both Inner and Outer zones of the estuary.
Usage
data(estuaryZone)Format
A dataframe containing (amongst other things):
- Mod
A factor describing whether the sample was taken from a 'Modified' or 'Pristine' estuary.
- Zone
Whether the sample was taken from Inner (upstream) or Outer (downstream) zone of the estuary.
- Estuary
A factor with seven levels identifying which estuary the sample was taken from.
- Total
Total abundance of all invertebrates in the sample
- Richness
Richness of taxa in the sample -- the number of responses (of those in columns 8-94) taking a non-zero value
Other variables in the dataset give invertebrate counts separately for different taxa.
References
Clark, G. F., Kelaher, B. P., Dafforn, K. A., Coleman, M. A., Knott, N. A., Marzinelli, E. M., & Johnston, E. L. (2015). What does impacted look like? high diversity and abundance of epibiota in modified estuaries. Environmental Pollution 196, 12-20.
Examples
data(estuaryZone)
cols=c("blue","red","lightblue","pink")
plot(Total~interaction(Estuary,Zone),data=estuaryZone,col=cols[c(1,2,2,1,2,1,2,3,4,4,3,4,3,4)])
